Monitoring Services with Uptime Kuma
If you run self-hosted apps, home lab services, or production infrastructure, you know the feeling: is it just me, or is the service down? Instead of waiting for someone to complain (or discovering it yourself when you try to use it), it’s better to have a monitoring tool that tells you when things break — and ideally before your users notice.
That’s where Uptime Kuma comes in.
What is Uptime Kuma?
Uptime Kuma is a self-hosted, open-source status monitoring tool. Think of it as a free, self-managed alternative to services like UptimeRobot or StatusCake. It lets you monitor websites, APIs, and network services, then alerts you when they go down.
Key features:
- Multiple monitor types: HTTP(s), TCP, ICMP (ping), DNS, Push, and more.
- Customisable alerts: Email, Telegram, Discord, Slack, Gotify, Pushover, etc.
- Beautiful dashboard: A clean web interface with status history and charts.
- Public status pages: Share uptime with your team or community.
- Self-hosted: You control the data and deployment.
Why Use Uptime Kuma?
- Keep an eye on home lab services (Pi-hole, Home Assistant, media servers).
- Monitor production apps and APIs with confidence.
- Get alerts quickly instead of discovering downtime by accident.
- Track historical uptime for troubleshooting or reporting.
- Run it anywhere — from a Raspberry Pi to a cloud VPS.
Installing Uptime Kuma
Using docker
The easiest way to get started is with Docker:
docker run -d \
  --restart=always \
  -p 3001:3001 \
  -v uptime-kuma:/app/data \
  louislam/uptime-kuma
This runs Uptime Kuma on port 3001 and persists data in a Docker volume.
Then, open http://your-server:3001 in a browser, create an admin account, and you’re ready to go.
Using Proxmox LXC
Kuma is even easier to setup in Proxmox using a LXC Container, there is a community script available and its instructions can be found here:
https://community-scripts.github.io/ProxmoxVE/scripts?id=uptimekuma
Always good to review scripts before blindly running them on your hardware but its as simple as running the following script and following the steps in the console
bash -c "$(curl -fsSL https://raw.githubusercontent.com/community-scripts/ProxmoxVE/main/ct/uptimekuma.sh)"Adding a Monitor
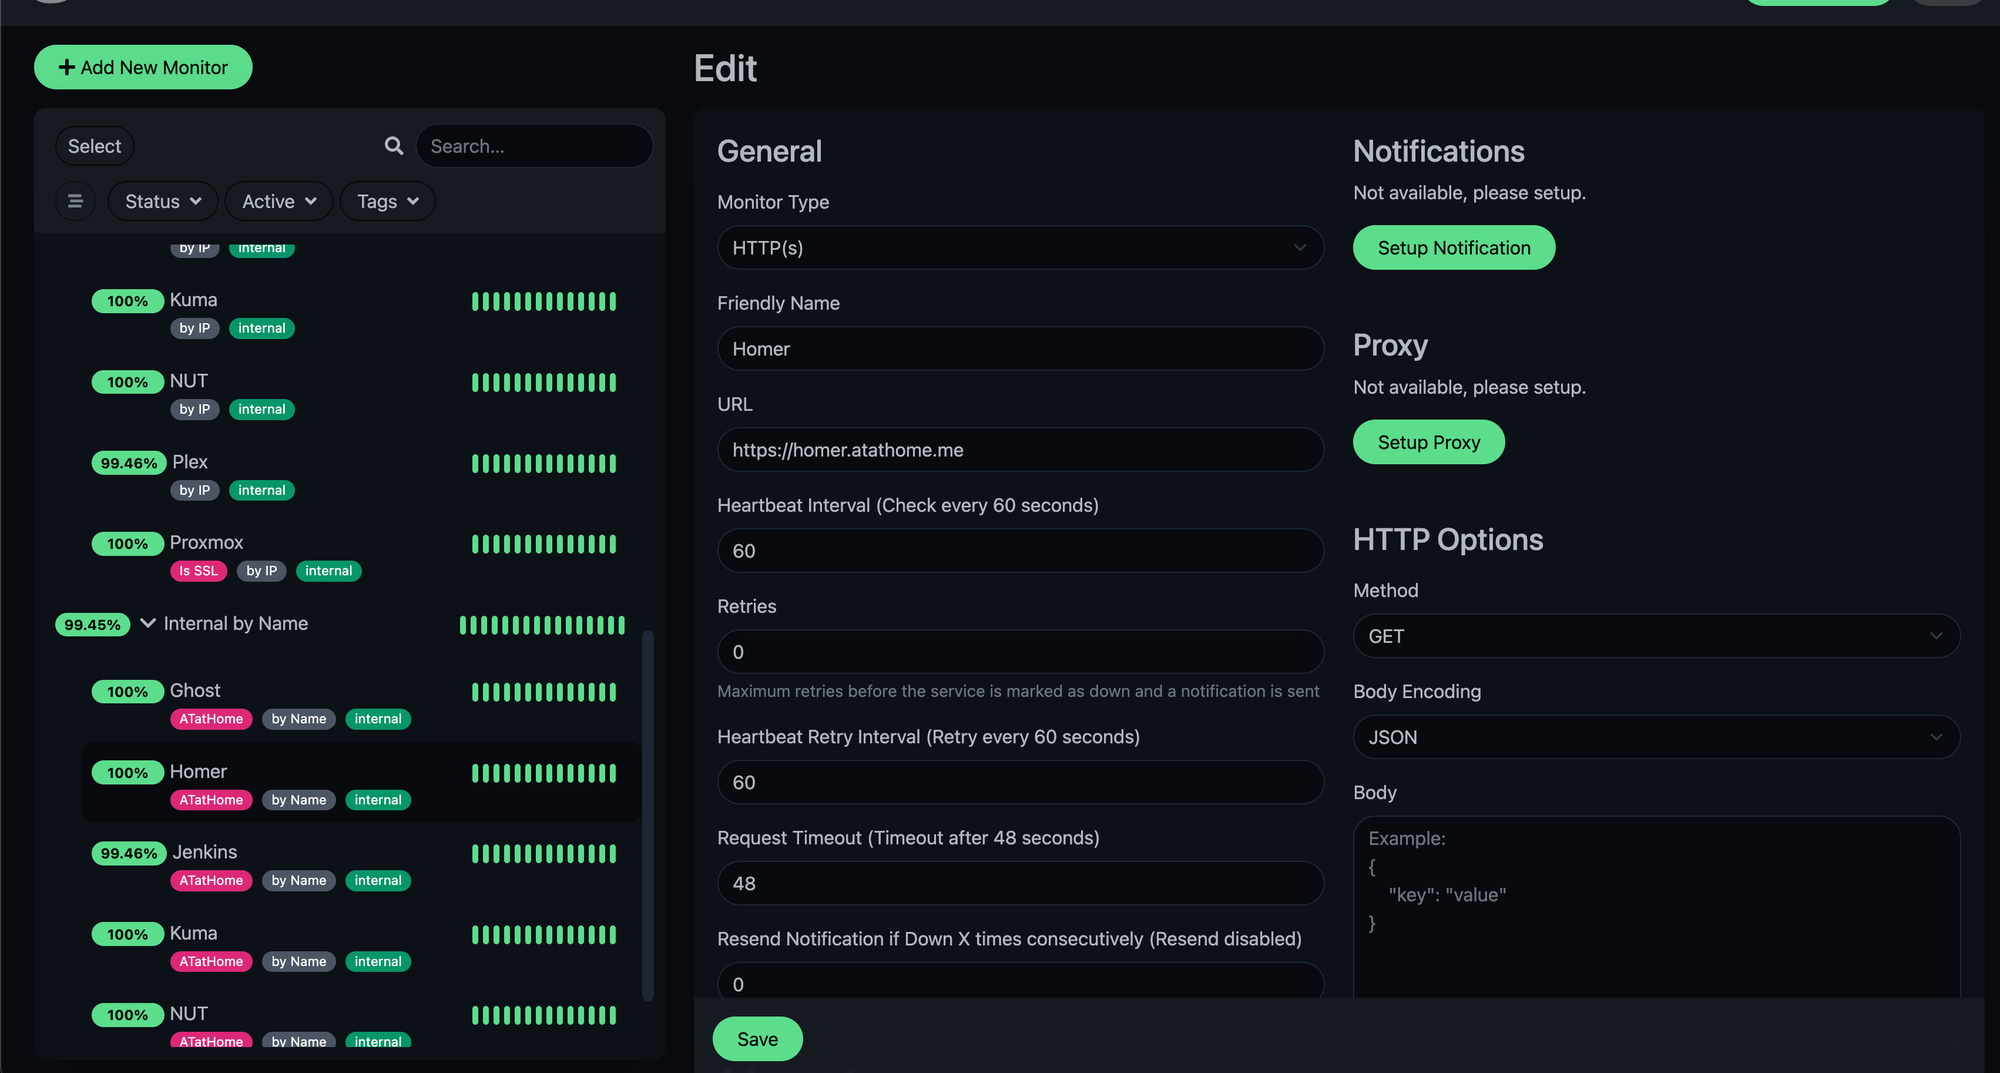
- Log in to the dashboard.
- Click Add New Monitor.
- Choose a monitor type (e.g., HTTP(s), Ping, TCP).
- Enter the target URL or IP.
- Configure interval, timeout, and retries.
- Save — and your monitor starts running.
You’ll see real-time status updates, response times, and uptime percentages.
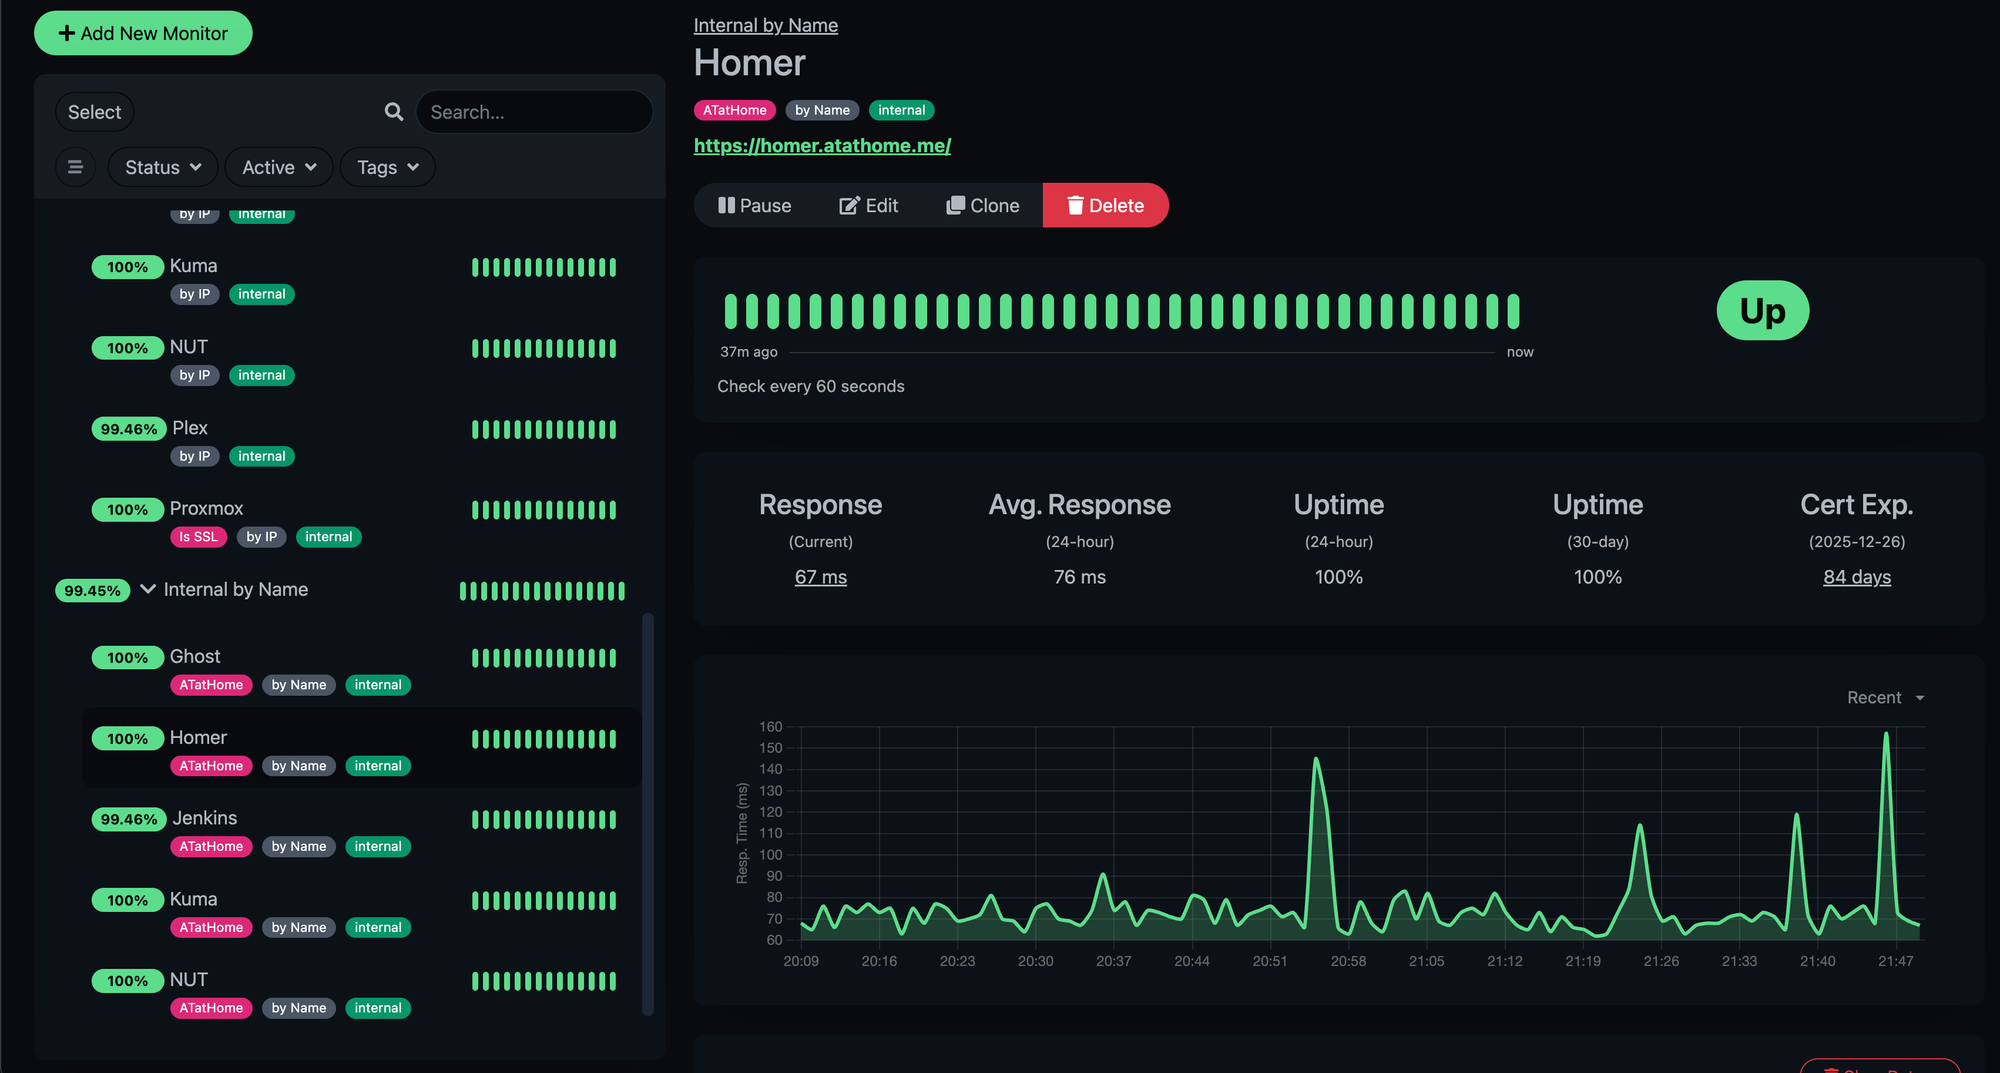
You can take this further by assigning meaningful Tags to categorise monitors such as in my example if it is a public facing endpoint or an internal endpoint.
Setting Up Alerts
Uptime Kuma supports a wide range of notifications. For example, to set up Telegram alerts:
- Go to Settings → Notification.
- Add a new notification of type Telegram Bot.
- Provide your bot token and chat ID.
- Link it to one or more monitors.
Now, you’ll get a Telegram message whenever a service goes down or comes back up.
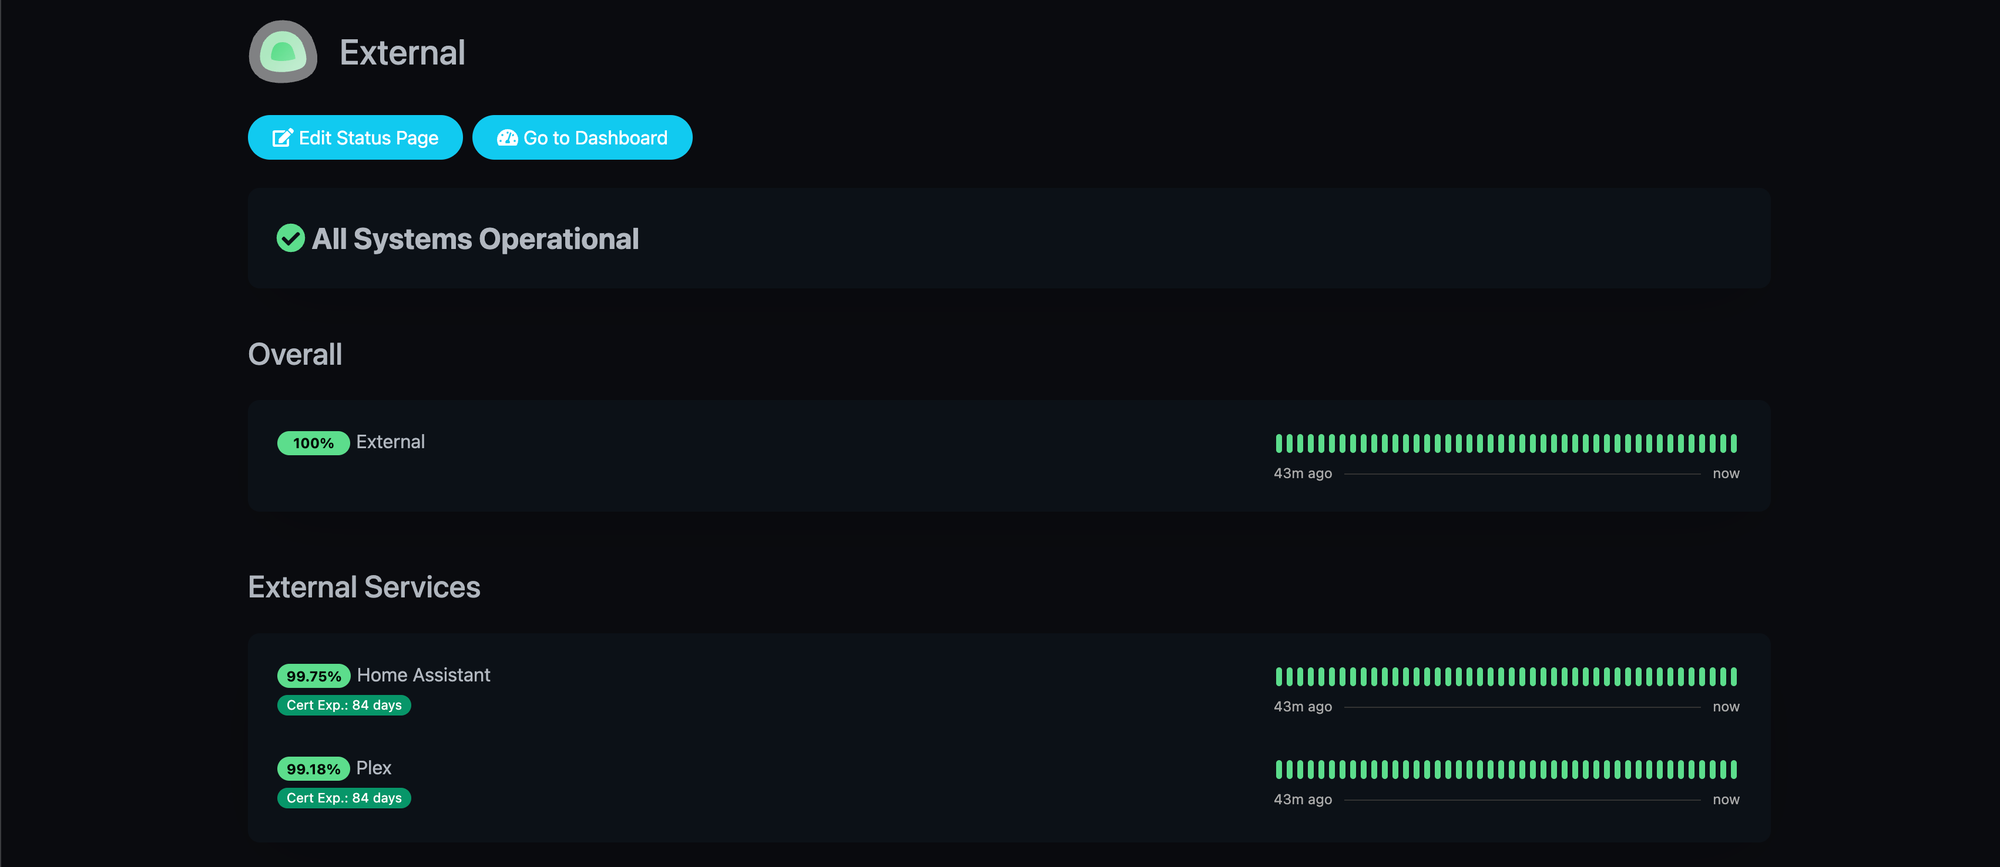
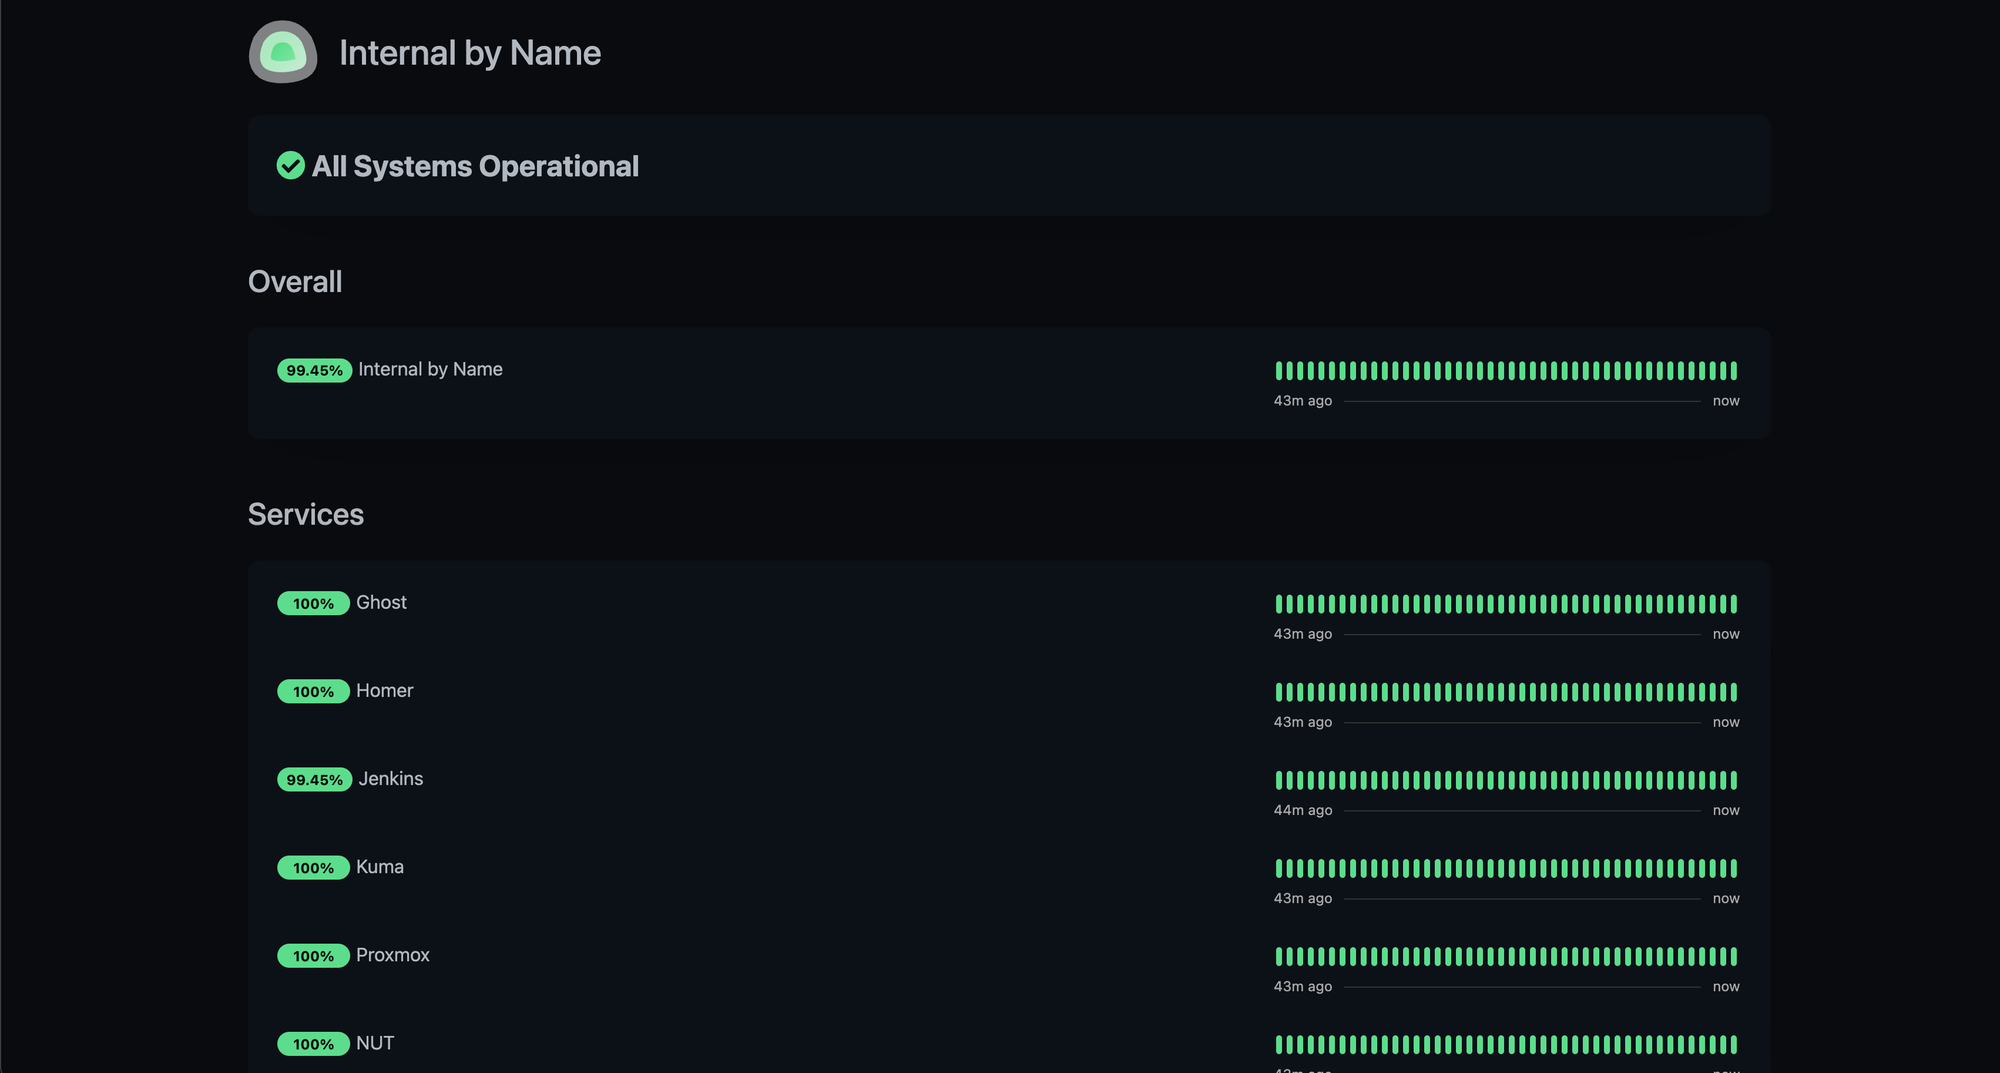
Public Status Page
One of Uptime Kuma’s nicest features is the ability to generate a public status page. This is great if you’re running services for others (or just want a clean way to check everything at a glance).
You can create multiple pages — for example:
- Internal status page for your home lab.
- External status page for services your users access.
Each page shows uptime graphs, response times, and the current state of your monitors.
Conclusion
Uptime Kuma is an excellent, self-hosted alternative for service monitoring. It’s lightweight, feature-rich, and easy to deploy. Whether you’re running a home lab, side projects, or production systems, Kuma gives you peace of mind by watching your services and notifying you when something breaks.
If you’ve been relying on hope (or user complaints) to know when things go down, give Kuma a try — your future self will thank you.
References